TLDR
- Solana (SOL) price has bounced from $95.2 to over $110, showing a 16.7% growth in four days
- A veteran whale purchased 32,000 SOL worth $3.72 million after a six-month hiatus
- SOL broke through the $120 resistance barrier with a 10% jump
- Technical analysis shows a falling wedge pattern that could signal a bullish breakout
- Next potential resistance levels are at $125, $132, and possibly $140
Solana has shown strong recovery signals after falling 6.5% during Thursday’s U.S. trading session. The downturn came amid a broader market sell-off as trade tensions between China and the United States continue to escalate.
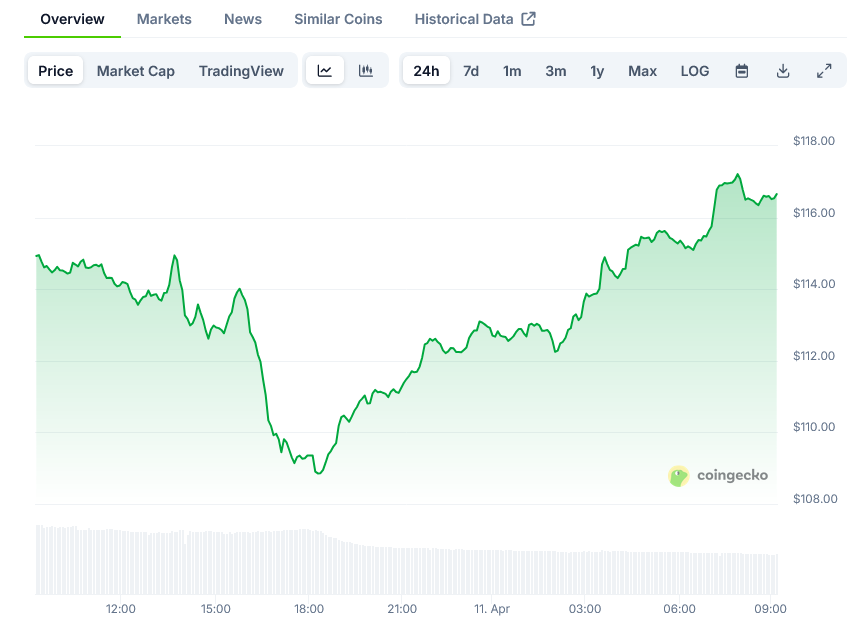
Despite the market suggesting further decline, large investors are showing confidence in SOL’s potential growth. The price has bounced from $95.2 to $111.12, registering a 16.7% increase over the last four days.
The recovery comes as on-chain data points to renewed accumulation from experienced investors. This bullish behavior has helped push SOL through the $120 resistance level, marking a 10% upward move after forming a base near the $100 support zone.
Solana $SOL is currently testing the range Value Area Low (VAL) at $116
If it can flip this level into support, it could make a run towards the range Point of Control (POC) at $142 🚀 pic.twitter.com/XOfXWR0Q9y
— Trader Edge (@Pro_Trader_Edge) April 11, 2025
Whale Returns With Multi-Million Dollar Purchase
A veteran Solana whale has made a comeback after six months of inactivity, purchasing 32,000 SOL worth approximately $3.72 million at current prices.
According to blockchain analytics firm Lookonchain, this investor originally bought 30,541 SOL for $6.61 million three years ago when the token was trading at $216.
What makes this move interesting is that the investor never sold their position, even when SOL plummeted below $10 during bear market conditions.
This strong conviction from deep-pocketed investors could help stabilize SOL’s price support and fuel a bullish recovery.
A whale bought another 32,000 $SOL($3.72M) after 6 months.
This whale seems to be extremely bullish on $SOL.
Three years ago, he bought 30,541 $SOL($6.61M) at $216 and didn’t sell — even when $SOL dropped below $10.https://t.co/ouiQ0QsxeZ pic.twitter.com/qMDeQoks7T
— Lookonchain (@lookonchain) April 10, 2025
Technical Indicators Point to Possible Breakout
The Solana price action has followed a falling wedge pattern since November 2024. The price has been moving between two converging trendlines, driving a high-momentum correction.
On April 6th, SOL appeared to break down from the yearly support level of $112 and the 50% retracement level. Losing this accumulation zone would typically signal accelerating bearish momentum.
However, the price action showed a lack of follow-through on the downside, suggesting weak seller conviction. This false breakdown may have set the stage for a bullish reversal.
The daily chart analysis shows buyers positioning to breach the resistance trendline of the falling wedge pattern. A successful flip of this overhead resistance into support could signal an early change in market sentiment.
Key Support and Resistance Levels
If Solana fails to maintain its upward momentum, several support levels could cushion any downside movement. The first immediate support sits at $112, followed by $110.
These levels correspond to previous resistance points and Fibonacci retracement markers, offering potential buying opportunities if the price pulls back.
A breakdown below these levels could see SOL revisit the $105 and $100 zones, both of which have been pivotal during recent market activity. The $100 mark remains a crucial line of defense for Solana in the short term.
On the upside, Solana faces major resistance tiers at $118 and $120. These levels have become technical barriers that retailers are actively defending.
For SOL to continue its upward trajectory, it needs a strong breakout above these levels. A successful push through $120 could open the door to higher targets, with the next resistance viewed at $125.
If the momentum continues, additional resistance levels lie at $132 and potentially even at $140. A move above $180 could be possible if the pattern plays out as expected.
Currently, SOL is consolidating below the $120 mark but trading above $105. Its 100-hour simple moving average reflects ongoing bullish sentiment, though technical indicators show some market indecision.
The moving average convergence divergence (MACD) indicator on the hourly chart has begun to lose momentum. However, the Relative Strength Index (RSI) continues to hold above the 50 mark, signaling ongoing, albeit weak, bullish pressure.
These mixed signals reflect broader uncertainty in the cryptocurrency market, suggesting traders should remain cautious while watching for confirmation of the next decisive move.


