TLDR:
- SOL price increased 12% but faces strong resistance at $120
- Technical indicators like RSI (45.52) show recovery but continued selling pressure
- Trump’s announcement of a 90-day tariff pause contributed to the rebound
- Experts predict SOL could reach $3,211 by 2030 if adoption increases
- Support levels near $95-100 are crucial; breaking below could push SOL under $90
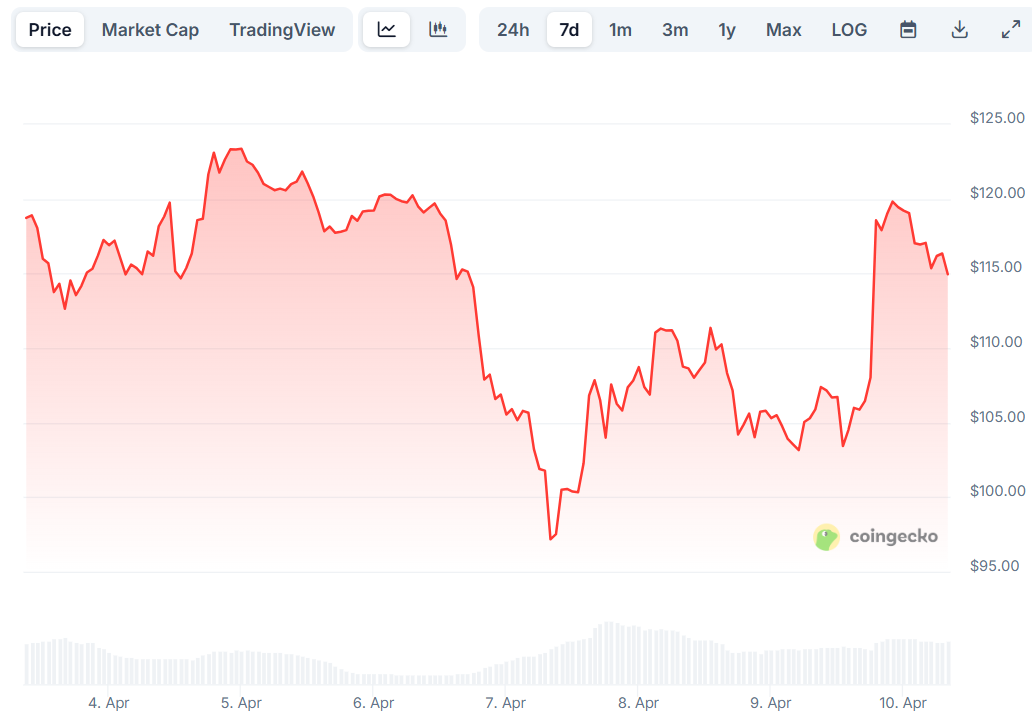
Solana (SOL) has seen a notable price increase of over 12% recently, but the cryptocurrency is now facing significant resistance around the $120 mark. The price jump follows a period of market volatility and comes after Trump announced a 90-day pause on tariffs, which helped boost market sentiment across the crypto sector.
The fifth-largest cryptocurrency by market cap started its upward movement from the $100 support zone, gaining momentum as it broke through the $105 and $112 resistance levels. This price action mirrors similar movements in other major cryptocurrencies like Bitcoin and Ethereum.
Technical analysis shows SOL broke above a bearish trend line with resistance at $107 on the hourly chart. The price reached a high of $120.10 before starting to retreat, indicating strong selling pressure at this level.
Despite this pullback, SOL continues to trade above $105 and the 100-hourly simple moving average, suggesting some underlying strength in the market.
Market Valuation and Historical Context
Solana currently has a market capitalization of approximately $66.15 billion, down from its historical peak of over $75 billion. The blockchain has demonstrated resilience throughout the bear markets of 2022 and 2023, quickly recovering after price dips.
The high-performance blockchain platform has gained popularity due to its speed, scalability, and expanding ecosystem of applications. These fundamental factors continue to support its value proposition even during periods of price volatility.
Investors who pay close attention to historical trends and real-time price movements are better positioned to identify optimal entry and exit points in the market. This approach helps navigate the frequent price swings characteristic of Solana and the broader crypto market.
Technical Indicators Point to Caution
The Relative Strength Index (RSI) for Solana currently sits at 45.52, hovering below the neutral midline of 50. This reading comes after the RSI briefly touched oversold territory at 21.53 two days ago, suggesting that extreme selling pressure has eased but bullish momentum hasn’t fully taken control.
Another technical indicator, the BBTrend (Bollinger Band Trend), has reached -14.19, its lowest level since mid-March. This negative reading indicates that bearish momentum might be building again after a period of relative stability.
The arrangement of Exponential Moving Averages (EMAs) also reflects a bearish structure, with short-term averages remaining below long-term ones. This configuration typically signals that downward momentum remains in control.
If SOL fails to break above the $118-120 resistance zone, it could face another decline. Support levels to watch include $112, $110, and the more critical $105 zone. A break below $105 might send the price toward the $100 support level.
Price Drivers and Future Outlook
Several factors influence Solana’s price movements, including network activity, supply-demand dynamics, staking metrics, and the broader economic environment. Currently, the staking rate exceeds 5%, which reflects confidence in the long-term health of the network.
Network upgrades like Token Extensions are driving developer adoption and user engagement, potentially creating more demand for SOL tokens.
On the technical side, SOL appears to be forming a cup and handle pattern—historically a bullish indicator. If this pattern plays out as expected, Solana could break out to higher price levels.
Looking further ahead, some experts have made ambitious predictions for SOL’s future value. There are forecasts suggesting SOL might reach $3,211 by 2030, based on its potential to onboard over 100 million users through decentralized applications (dApps).
Short-Term Outlook
For the immediate future, if Solana can maintain its current strength and attract more buying interest, it could test the resistance at $120 again. A successful break above that level might open the path toward the next target at $134.
However, if the current bearish trend persists, Solana could revisit support near $95, a level that has previously served as a short-term floor. Losing this level would be technically significant and could potentially push SOL below $90—a price point not seen since January 2024.
Traders should watch for key support and resistance levels in the coming days. The $118-120 zone represents a major hurdle, while support around $110 and $105 will be crucial in preventing a deeper decline.


