TLDR:
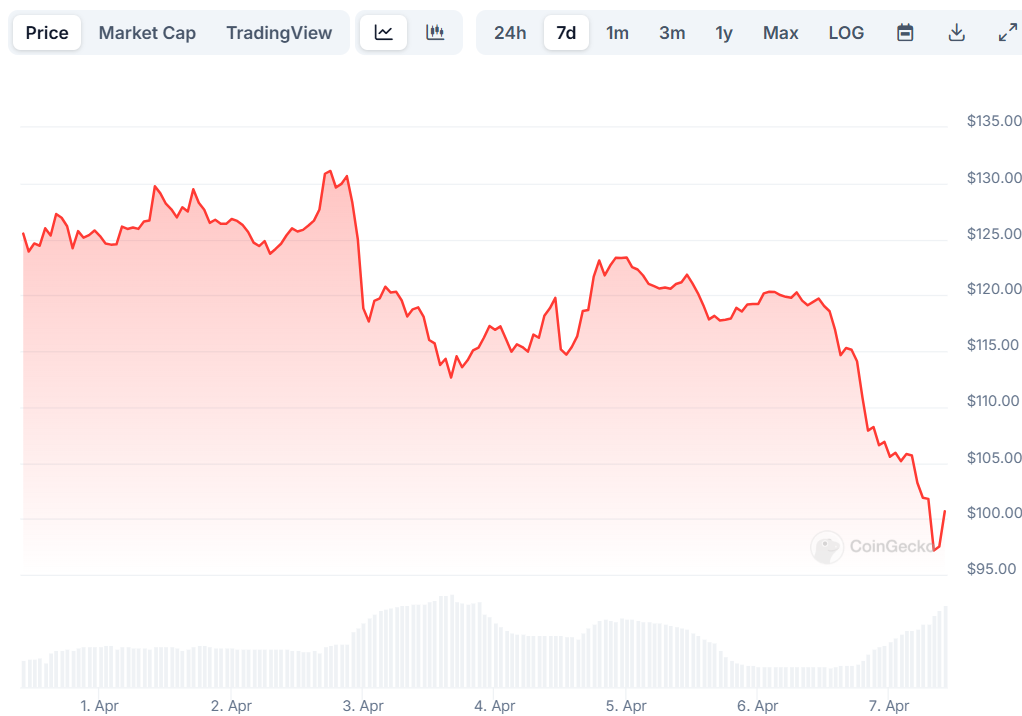
- SOL has plunged below $100, marking a 14-month low
- Price dropped over 20% in a single trading session
- Technical indicators show oversold conditions suggesting potential rebound
- Active addresses on Solana network have decreased to 4.44 million
- Critical support levels now rest at $100, $92, and $84
The cryptocurrency market has taken a sharp downturn, with Solana (SOL) being one of the hardest hit among major digital assets. The price of SOL has crashed below the psychological $100 barrier, reaching levels not seen in over 14 months.
Recent market data shows that SOL experienced a dramatic 20.8% drop during intraday trading, touching $97 before a slight rebound. This marks a substantial decline from its recent trading range and has left many investors concerned about further potential losses.
The downward movement began when SOL broke below several key support levels. First falling under $122, then quickly dropping past $115, and finally breaking through the critical $112 support zone.
Chart analysis indicates that a contracting triangle pattern with support at $118 was violated on the hourly timeframe. This technical breakdown has accelerated the selling pressure, leading to the current price levels.
The cryptocurrency now trades well below its 100-hourly simple moving average, a commonly watched technical indicator that suggests bearish momentum remains in control of the market.
Technical Analysis Points To Extreme Weakness
The current price action for Solana shows considerable weakness across multiple timeframes. The asset is trading below the 23.6% Fibonacci retracement level measured from the recent swing high of $121 to the low of $102.
For SOL to begin showing signs of recovery, it would need to first overcome resistance at the $105 level. Beyond that, more substantial resistance appears at $112, which aligns with the 50% Fibonacci retracement level of the recent decline.
Only a decisive move above $116 could potentially signal a trend reversal and open the path toward the $120 and eventually $125 levels.
The hourly MACD indicator continues to gain momentum in the bearish zone, while the Relative Strength Index (RSI) remains below the neutral 50 level. Both technical indicators support the current negative outlook.
However, the RSI has moved into oversold territory, dipping below the 30.0 threshold. Historically, when SOL’s RSI has reached such levels, price rebounds have often followed. This gives some traders hope that a short-term bounce may be possible.
Network Activity Shows Interesting Patterns
Despite the price collapse, on-chain data provides some interesting insights into user behavior on the Solana network.
The number of active addresses has reached a 6-month low, with approximately 4.44 million addresses currently interacting with the network. This represents a significant decline from the January peak of around 9 million active addresses.
Some analysts interpret this reduction in activity as users waiting on the sidelines for clearer market direction before re-engaging with the network. This behavior is typical during periods of extreme market volatility.
Interestingly, data suggests that many long-term Solana investors are maintaining their positions despite the price drop. This holder behavior could potentially provide support and prevent further dramatic declines.
The loyalty of the investor base has been a characteristic feature of the Solana ecosystem through previous market cycles, with many believers in the technology looking beyond short-term price movements.
Market Context And External Factors
The broader cryptocurrency market has been under pressure, with Bitcoin and Ethereum also experiencing notable declines. This market-wide weakness has contributed to Solana’s troubles.
Current market sentiment has been heavily influenced by worries about trade tensions and growing concerns regarding a potential financial crisis. Some market observers have drawn parallels to the 1987 “Black Monday” event, adding to investor anxiety.
These external factors have created an environment where risk assets, including cryptocurrencies, face significant selling pressure as investors seek safer alternatives.
For Solana specifically, the break below $100 represents not just a psychological barrier but also a technical level that had previously served as support during earlier market corrections.
Looking Forward: Support And Resistance Levels
If SOL fails to reclaim the $105 level in the near term, further declines appear likely. The immediate support now rests around $102, with the major psychological support at $100.
A definitive breakdown below $100 could trigger additional selling, potentially pushing the price toward the $92 zone. Should this level also fail to hold, the next significant support appears at $84.
On the other hand, if market conditions improve and SOL can break above $100 and establish it as support, a recovery phase could begin. Many investors might view the current 14-month low as an attractive entry point, potentially bringing new capital into the ecosystem.
The next few days will be critical in determining whether Solana can stabilize and begin a recovery process or if further downside is likely. Traders will be closely monitoring the key support and resistance levels mentioned above.
The market’s response to these levels will provide valuable insights into the potential direction of SOL price in the coming weeks.


