TLDR:
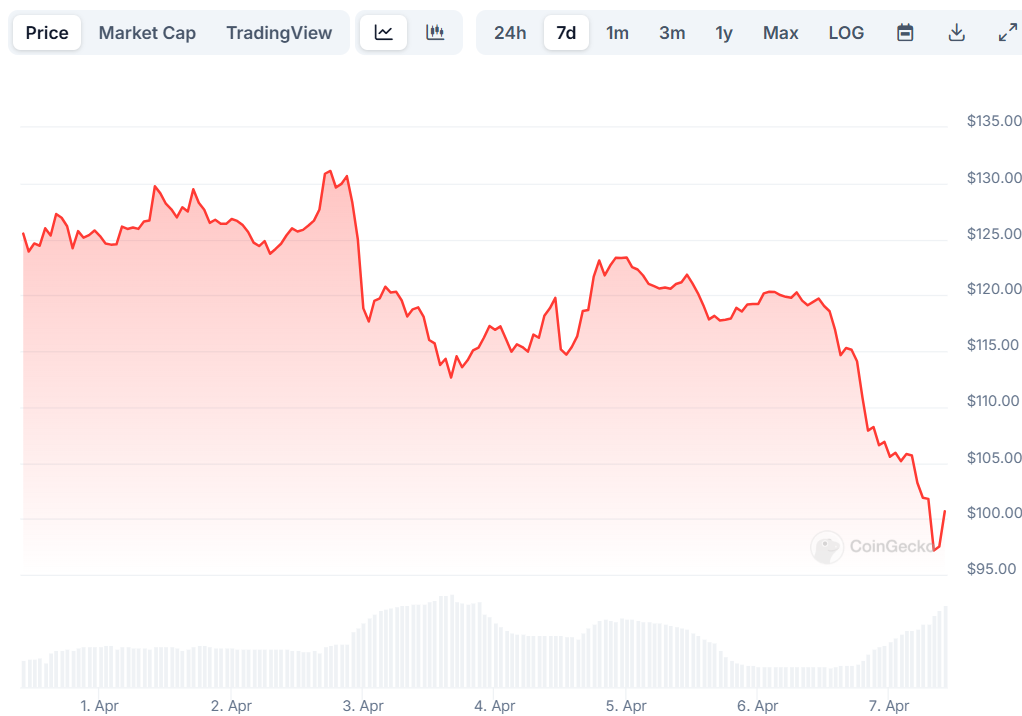
- SOL price has fallen below the $100 mark, dropping over 20% in recent trading
- The cryptocurrency has reached a 14-month low amid broader market weakness
- Active addresses on Solana network hit a 6-month low of 4.44 million
- Technical indicators show SOL in oversold territory, suggesting potential rebound
- Key support levels to watch are $100, $92, and $84
Solana, once a high-flying cryptocurrency that competed with Ethereum for developer attention and user adoption, has experienced a dramatic price decline in recent days. The cryptocurrency has plummeted below the $100 mark, representing a 14-month low and raising concerns among investors about its near-term trajectory.
The recent price action shows SOL dropping more than 20% during intraday trading, falling to approximately $97. This represents a significant downturn from recent price levels, with the cryptocurrency now trading well below key technical indicators.
Market data indicates that Solana started its fresh decline by breaking below critical support zones at $122 and $115. The downward momentum accelerated as it fell through the $112 level, entering what analysts describe as a bearish zone.
Technical chart analysis reveals a break below a key contracting triangle with support at $118 on the hourly SOL/USD pair chart. The price has declined over 15% and traded close to the $102 level before briefly consolidating.
Market Conditions Driving the Decline
The broader cryptocurrency market has been experiencing weakness, with Bitcoin and Ethereum also showing downward trends. This market-wide pressure appears to be contributing to Solana’s troubles.
Current price action remains bearish below the 23.6% Fibonacci retracement level of the downward move from the $121 swing high to the $102 low. Solana is now trading below $105 and the 100-hourly simple moving average, both negative technical signals.
On the upside, SOL faces resistance near the $105 level. The next major resistance lies around $112, or the 50% Fibonacci retracement level of the recent downward move. Only a successful close above the $116 resistance zone could potentially set the stage for another steady increase.
The current weakness is largely attributed to ongoing trade tensions and fears of a possible financial crisis. Some market commentators have even drawn parallels to the 1987 “Black Monday” scenario, heightening investor anxiety across asset classes.
Network Activity and User Behavior
Despite the price decline, there are interesting developments in network activity. The number of active addresses on the Solana network has recently hit a 6-month low, with around 4.44 million addresses engaging on the platform.

This represents a notable decline from January’s peak of 9 million active addresses. While this drop might appear concerning at first glance, some analysts suggest it indicates that investors are likely waiting for a strong recovery before becoming more active on the network.
Interestingly, despite the price downturn, Solana’s loyal investor base continues to hold their positions. This behavior signals potential support that could prevent further price declines, with many investors remaining hopeful for a rebound based on the network’s history of bouncing back after previous downturns.
Technical Indicators and Future Outlook
The Relative Strength Index (RSI) for Solana is currently sitting in the oversold zone, below the critical 30.0 mark. This technical indicator suggests that the bearish momentum may be approaching its exhaustion point, potentially setting up conditions for a reversal.

Historical data shows that when SOL has previously dipped into oversold territory, the price has often rebounded. This pattern gives some investors hope that the current situation might follow similar precedent if broader market conditions stabilize.
If SOL fails to rise above the $105 resistance, it could trigger another decline. Initial support on the downside is near the $102 zone, with major support at the $100 level. A break below this psychological barrier might send the price toward the $92 zone.
Should the price close below the $92 support, the decline could extend toward the $84 support level in the near term. These price points represent critical areas to watch for both traders and investors in the coming days.
If the price manages to break above the $100 mark and hold it as support, positive momentum could return. Many investors may view the current 14-month low as a buying opportunity, potentially injecting new capital into the network and helping to stabilize the price.
However, if broader market conditions fail to improve, Solana’s price may continue to struggle. A drop below the $90 support level would invalidate any bullish outlook and could extend losses further.
The hourly MACD for SOL/USD is gaining pace in the bearish zone, while the RSI remains below the 50 level – both indicating continued weakness in the immediate term.
For now, Solana traders and investors will be watching key support levels at $102, $100, and $92, while monitoring resistance at $105 and $112 for any signs of a potential recovery.
Stay Ahead of the Market with Benzinga Pro!
Want to trade like a pro? Benzinga Pro gives you the edge you need in today’s fast-paced markets. Get real-time news, exclusive insights, and powerful tools trusted by professional traders:
- Breaking market-moving stories before they hit mainstream media
- Live audio squawk for hands-free market updates
- Advanced stock scanner to spot promising trades
- Expert trade ideas and on-demand support
Don’t let opportunities slip away. Start your free trial of Benzinga Pro today and take your trading to the next level!
Visit Benzinga Pro


